
Understanding Support and Resistance Levels in Trading
Introduction
In the world of trading, few concepts are as crucial as support and resistance levels. Whether you’re a beginner or an experienced trader, understanding these levels can significantly improve your market analysis and decision-making. Support and resistance are not just terms; they represent a psychological barrier in the market. They indicate areas where the price tends to pause, reverse, or consolidate. Mastering these concepts helps traders identify entry and exit points, manage risks, and predict market behavior more effectively.
In this blog, we’ll break down the meaning of support and resistance, explore different types, explain how to draw them, and show how traders use them to strategize trades.
What Are Support and Resistance Levels?
Support
Support is a price level where a downtrend can be expected to pause due to a concentration of demand. In simple terms, it’s a level where buyers tend to enter the market and push prices up. It’s called “support” because it supports the price from falling further. Imagine a stock falling to a certain price, say $50, and bouncing back up every time it hits that level. That $50 level becomes the support because it acts like a floor for the price.
Resistance
Resistance, on the other hand, is a price level where a rising market tends to pause or reverse due to a concentration of selling interest. It acts like a ceiling that the price struggles to break through.
Using the same example, if a stock repeatedly rises to $70 and then falls back, that $70 becomes the resistance level.
Why Support and Resistance Matter
Support and resistance are fundamental tools for traders because:
They help identify potential entry and exit points
They act as indicators of trend strength or weakness
They can be used to place stop-loss and take-profit orders
They help in determining market sentiment
Markets are driven by psychology. Buyers and sellers remember past price levels where price movements changed direction. These memory zones become future barriers in the form of support and resistance.
Types of Support and Resistance
There are several types of support and resistance levels used in trading. Each one provides insight into how the market might behave.
1.Horizontal Support and Resistance
These are the most commonly used levels. They are based on past price movements and are easy to identify on a chart. A horizontal support or resistance level is drawn across a price level where the market has repeatedly bounced or reversed.
2.Trendlines
Support and resistance can also be dynamic, moving with the trend. When the market is trending upwards, a trendline drawn under the lows acts as support. In a downtrend, a trendline drawn above the highs acts as resistance.
Trendlines give visual insight into the overall direction of the market and help anticipate where the price may reverse or continue.
3.Moving Averages
Some traders use moving averages (like the 50-day or 200-day moving average) as dynamic support and resistance. Price often reacts to these averages, especially in trending markets.
4.Psychological Levels
Traders often react to round numbers like 1.0000 in forex or $100 in stocks. These are known as psychological levels, and they can act as powerful support or resistance zones.
5.Fibonacci Levels
Fibonacci retracement levels (such as 38.2%, 50%, and 61.8%) are used to identify possible reversal points in a trend. These levels often act as temporary support and resistance in trending markets.
6.Pivot Points
Pivot points are calculated using the previous day’s high, low, and close. They are widely used by intraday traders to determine key levels for the next trading session.
How to Draw Support and Resistance
Drawing support and resistance correctly is essential for effective trading. Here’s how to do it:
Step 1: Use a Clear Timeframe
Choose a timeframe that suits your trading style. For day trading, 15-minute to 1-hour charts are common. For swing or long-term trading, 4-hour or daily charts are better.
Step 2: Identify Price Reversal Points
Look for areas where the price reversed direction more than once. These could be swing highs or swing lows.
Step 3: Draw Horizontal Lines
Mark the levels where the price has reversed multiple times. These lines will serve as your support or resistance zones.
Step 4: Adjust and Refine
Support and resistance levels are not always exact. Sometimes, they are better represented as zones instead of exact price points.
Support and Resistance as Zones
It’s important to understand that support and resistance are often zones and not precise lines. Price may move slightly above or below a level before reversing. Therefore, many traders consider an area (say a range of a few points or pips) as the true zone of support or resistance.
How to Trade Using Support and Resistance
Support and resistance can be used in various trading strategies. Here are some of the most common ones:
1.Bounce Trading
In bounce trading, a trader waits for the price to approach a support or resistance level and then enter a trade in the opposite direction.
Buy near support when the price bounces up
Sell near resistance when the price reverses down
2.Breakout Trading
Sometimes, the price breaks through support or resistance. Traders look to buy when resistance breaks and sell when support breaks.
However, breakouts can be false. To avoid fake breakouts, traders often wait for confirmation, like a strong candle close beyond the level or a retest of the level, before entering.
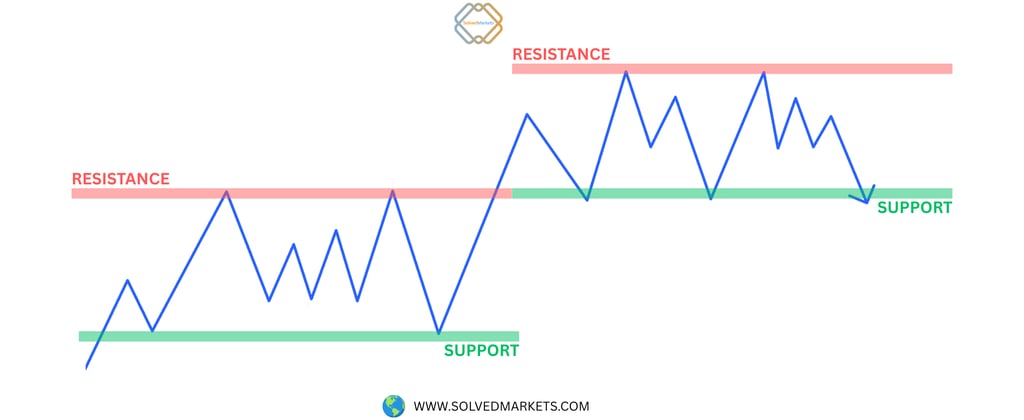
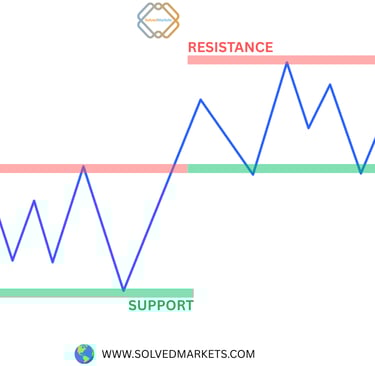
3.Support Becomes Resistance (and Vice Versa)
Once a support level is broken, it can become a resistance level in the future. The opposite is also true. This concept is known as a role reversal.
Example: If a stock breaks below $50 (support), the same $50 may act as resistance when the price moves back up.
Combining Support and Resistance with Indicators
Support and resistance work best when combined with other tools like:
RSI: Overbought or oversold signals near resistance or support levels
MACD: Confirm trend reversals near key levels
Volume: High volume on breakouts confirms strength
Candlestick Patterns: Reversal patterns near key levels (like doji, engulfing, pin bars)
Common Mistakes to Avoid
Expecting Exact Price Reactions
Price may not reverse exactly at a level. Be open to zones and allow for small deviations.
Ignoring the Bigger Picture
Always analyze support and resistance in the context of the overall trend and higher timeframes.
Overloading Charts
Don’t draw too many levels. Focus on the most relevant and obvious ones.
Falling for False Breakouts
Use confirmation and volume to avoid false breakouts. Don’t trade on the first breakout candle without supporting evidence.
Real-Life Example
Let’s say you’re analyzing EUR/USD on the 1-hour chart.
Price has bounced off 1.0800 three times in the last week.
Price has reversed at 1.0900 twice.
This gives you a support zone at 1.0800 and a resistance zone at 1.0900.
You can plan:
Buy at or near 1.0800 with a stop below and a target near 1.0900
Or, wait for a breakout above 1.0900 and buy the retest of that level
Conclusion
Support and resistance are the foundation of technical analysis in trading. They reflect real market psychology and help traders make informed decisions.
By understanding how to identify, draw, and use these levels effectively, traders can gain a significant edge. But like any tool, they are not foolproof. Support and resistance should be used in conjunction with other indicators, sound risk management, and trading discipline.
Here’s a quick summary:
Support prevents the price from falling further
Resistance prevents the price from rising further
Levels can be horizontal or dynamic (trendlines, moving averages)
Use zones rather than precise points
Combine with indicators and candlestick patterns
Be patient and wait for confirmation before entering trades
Mastering support and resistance takes practice, but once you do, it becomes one of the most powerful tools in your trading arsenal.


Learn Financial Markets with Ease – Simple, Relaxing, and Practical Learning
Empowering traders of all levels with easy-to-understand financial market education. Learn Forex, Stocks, Crypto, and more with expert guidance and practical insights. Start your journey to financial success today
Risk Disclaimer: Trading or Investing in financial markets involves significant risk and may not be suitable for all investors. The value of investments can go up or down, and you may lose all of your investment as well. Always conduct thorough research and seek professional advice before making any trading decisions.
Solved Group PTY is a registered organisation by ASIC(Australian Securities and Investments Commission) under license number: 084 529 162