
Understanding Trend Lines and Channels in Trading
Introduction
In technical analysis, two of the most powerful yet straightforward tools traders use are trend lines and channels. They are visual representations of market sentiment and trend direction, helping traders identify high-probability trade opportunities with confidence. Whether you’re trading forex, stocks, cryptocurrencies, or commodities, mastering trend lines and channels will give you a strong edge. This blog will walk you through the basics, applications, and strategies associated with these tools—no jargon, just simple explanations.
What Are Trend Lines?
A trend line is a straight line drawn on a chart that connects two or more price points and extends into the future to act as a line of support or resistance. It helps traders visually identify the direction and strength of a market trend.
There are two primary types of trend lines:
1.Uptrend Line (Bullish Trend Line)
An uptrend line is drawn by connecting higher lows in a rising market. It acts as a support line, showing where buyers are consistently entering the market.
Example: If a stock hits lows at $100, $110, and $120 over time, you can draw a trend line connecting those lows. This line tells you the price is rising, and buyers are stepping in at higher levels each time.
2.Downtrend Line (Bearish Trend Line)
A downtrend line is drawn by connecting lower highs in a falling market. It acts as a resistance line, showing where sellers are pushing the market down.
Example: If a cryptocurrency drops from $300 to $280, and then $260, drawing a line connecting these lower highs indicates a strong bearish trend.
Why Are Trend Lines Important?
Trend lines provide a framework for making trading decisions. Here’s what they help you do:
Identify the trend direction (bullish, bearish, or sideways)
Spot potential reversal points
Confirm breakouts or breakdowns
Improve entry and exit timing
Set stop-loss and take-profit levels
The markets don’t move randomly—they follow patterns shaped by investor psychology. Trend lines give you insight into this behavior.
How to Draw Trend Lines Correctly
Drawing accurate trend lines is essential for reliability. Here’s how you can do it:
Step 1: Choose the Right Timeframe
Use a chart timeframe that fits your trading style:
Scalpers: 5–15 minute charts
Swing traders: 1-hour to daily charts
Position traders: Daily to weekly charts
Step 2: Identify Clear Highs or Lows
Look for at least two or more swing highs or lows that align. The more times a trend line is “respected” by the price, the stronger it becomes.
Step 3: Connect the Points
Draw a line using a charting tool that touches the significant highs (for downtrends) or lows (for uptrends). The line should extend into the future.
Step 4: Adjust if Needed
Trend lines are not always perfect. Sometimes price may slightly overshoot or undershoot. You can adjust the line to better capture the general trend, but don’t force it.
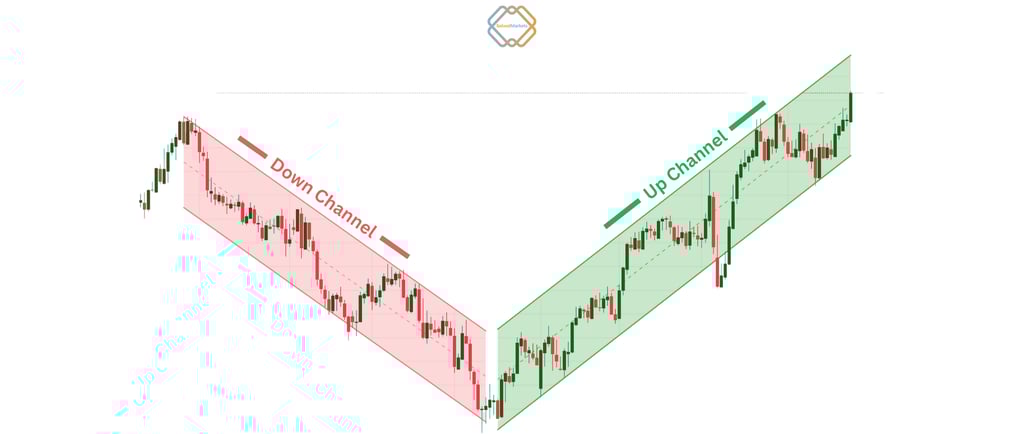
What Are Channels in Trading?
A channel is a trading range formed by two parallel trend lines—one connecting the highs and the other connecting the lows. Channels indicate the boundaries within which price is likely to move in a trending market.
There are three types of channels:
1.Ascending Channel (Bullish)
Both the upper and lower lines are sloping upward. The price tends to bounce between these two lines, forming higher highs and higher lows.
2.Descending Channel (Bearish)
Both lines slope downward. The price makes lower highs and lower lows within the channel.
3.Horizontal Channel (Sideways)
Also called a range-bound market, the channel is flat, indicating consolidation. Prices move back and forth within a horizontal support and resistance band.
How to Draw Channels
Step 1: Identify a Trend
First, establish whether the market is in an uptrend, downtrend, or ranging phase.
Step 2: Draw the Trend Line
Connect the lows in an uptrend or the highs in a downtrend using a straight line.
Step 3: Draw a Parallel Line
From the opposite side of the price movement (highs in an uptrend, lows in a downtrend), draw a line parallel to the trend line. This forms the channel.
Step 4: Validate the Channel
Check if the price respects both the upper and lower lines multiple times. If it does, you have a valid trading channel.
Trading Strategies Using Trend Lines and Channels
These tools are not just for drawing—they are meant to enhance your trading strategies. Below are several common techniques:
1.Bounce Trading Off Trend Lines
When the price approaches a trend line and bounces back, it can be a great entry point.
In an uptrend, look to buy near the trend line (support).
In a downtrend, look to sell near the trend line (resistance).
Stop-loss is placed slightly below (in an uptrend) or above (in a downtrend) the trend line.
2.Breakout Trading
When price breaks through a trend line, it may indicate a reversal or acceleration.
A break below an uptrend line could signal a bearish reversal.
A break above a downtrend line could signal a bullish reversal.
Wait for confirmation (such as a strong candle close) before entering the trade.
3.Channel Trading
When the price is moving within a channel:
Buy at the lower boundary
Sell at the upper boundary
This strategy works well in established channels. Always use stop-loss outside the channel in case of a breakout.
4.Channel Breakouts
Eventually, the price will break out of a channel. This often signals the beginning of a strong move.
If price breaks above an ascending channel, it may indicate bullish momentum.
If price breaks below a descending channel, it could trigger strong selling.
Breakouts are often accompanied by increased volume, so use volume as a confirmation tool.
Common Mistakes to Avoid
1.Forcing Trend Lines
If the trend line doesn’t match the price action naturally, don’t force it. An inaccurate trend line is worse than none at all.
2.Ignoring Timeframes
A trend line on a 5-minute chart may not hold the same weight as one on a daily chart. Always analyze multiple timeframes.
3.Overtrading Channels
Just because a channel exists doesn’t mean you should take every bounce. Wait for confirmation and manage risk properly.
4.Missing Breakout Confirmations
Don’t jump into breakouts without confirmation like strong volume or a candlestick close beyond the line.
Real-Life Example
Imagine you’re trading the EUR/USD pair:
You notice the price has been making higher lows since last week.
You draw a trend line connecting those lows.
Price bounces off the trend line three times.
You decide to enter a buy trade on the fourth bounce, placing a stop-loss slightly below the line. The price then moves up and hits your target.
Later, the price breaks below the trend line with strong momentum and volume. You now consider shorting on a retest of the broken trend line, which is now acting as resistance. This is how trend lines can guide your trading journey.
Conclusion
Trend lines and channels are among the most reliable and widely used tools in technical analysis. When drawn and used correctly, they can:
Help you spot and follow the market trend
Provide clear areas to enter and exit trades
Reduce trading noise and confusion
Increase your confidence in market analysis
However, no tool is perfect. Always combine trend lines and channels with other technical indicators like RSI, MACD, candlestick patterns, or volume for better accuracy.
Key Takeaways:
Trend lines define direction; channels define boundaries.
Two or more price points are needed to draw valid lines.
Don’t force patterns. Let them naturally emerge.
Breakouts and bounces both offer trading opportunities.
Practice on different timeframes to gain proficiency.
With patience and experience, trend lines and channels will become second nature—and they’ll serve as powerful allies in your trading journey.


Learn Financial Markets with Ease – Simple, Relaxing, and Practical Learning
Empowering traders of all levels with easy-to-understand financial market education. Learn Forex, Stocks, Crypto, and more with expert guidance and practical insights. Start your journey to financial success today
Risk Disclaimer: Trading or Investing in financial markets involves significant risk and may not be suitable for all investors. The value of investments can go up or down, and you may lose all of your investment as well. Always conduct thorough research and seek professional advice before making any trading decisions.
Solved Group PTY is a registered organisation by ASIC(Australian Securities and Investments Commission) under license number: 084 529 162